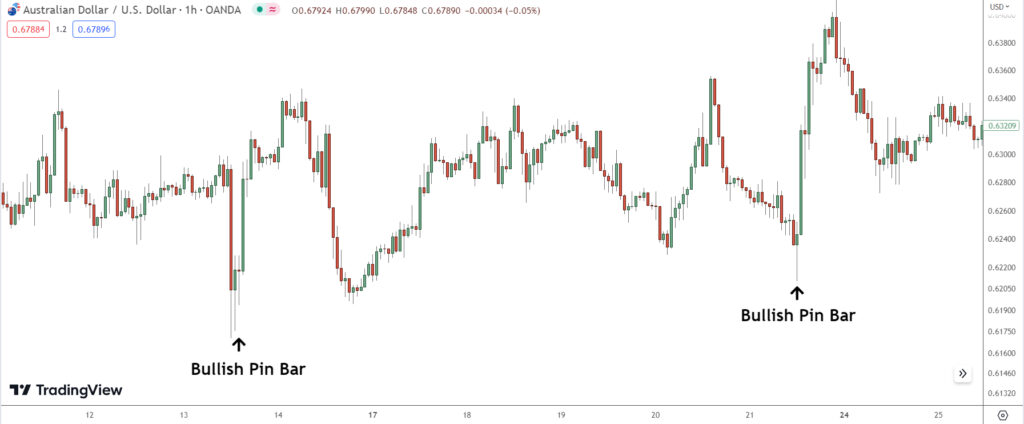
The pin bar pattern can be an effective way to identify potential reversals in the market, giving you a chance to capitalize on price shifts.
Here’s a simple step-by-step guide on how you might use this pattern in your trading strategy.
Identify the Pin Bar Candlestick: The first step is recognizing a pin bar on your chart. A pin bar typically has a small body (the color doesn’t matter, although green indicates a higher close and red indicates a lower close) and a long upper or lower wick, or ‘tail’. The tail should ideally be at least twice the length of the body to qualify as a pin bar.

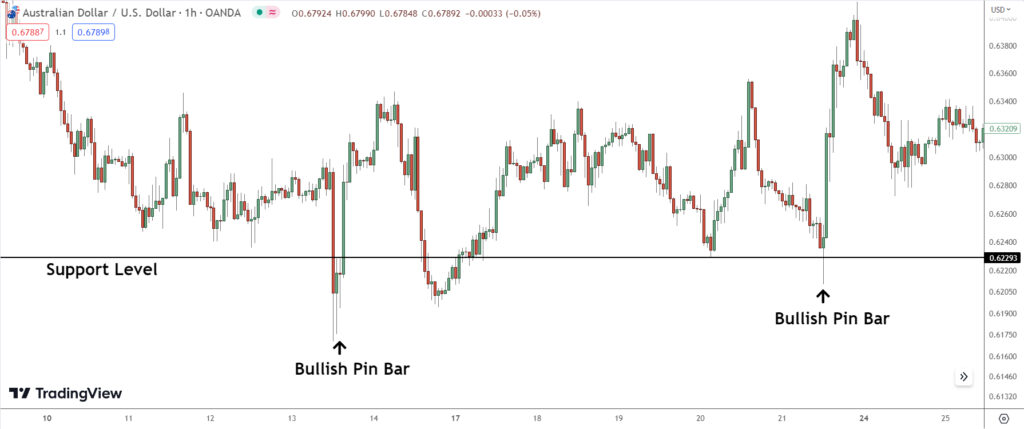
Look for Pin Bars at Key Market Levels: Pin bars are most effective when they form at or near significant market levels, such as support and resistance levels, pivot points, or Fibonacci retracement levels. These are the areas where price is most likely to reverse.

Confirm with Additional Indicators: Although the pin bar can be a powerful signal on its own, it’s always a good idea to use additional indicators or methods to confirm the signal. For example, you could look at the overall trend or use other technical indicators like Moving Averages or RSI.
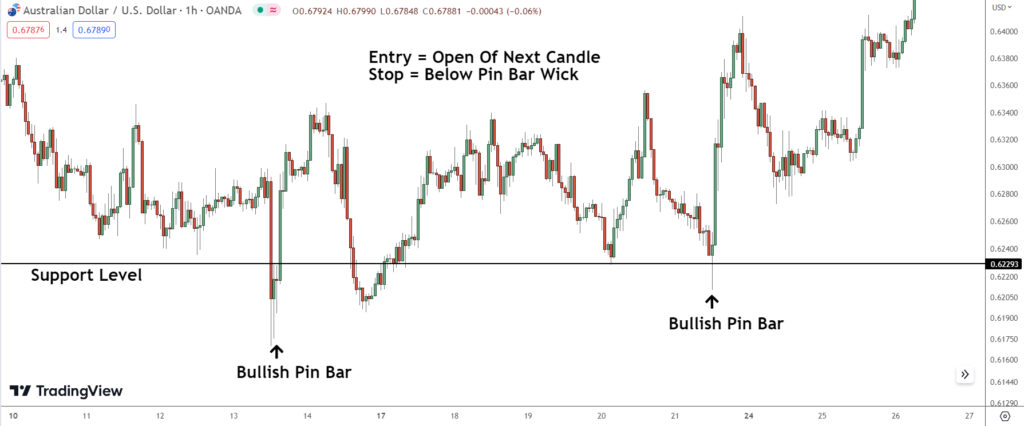
Enter the Trade: A common strategy is to place a trade order at the open of the next candle after the pin bar. If it’s a bullish pin bar (a pin bar that indicates a potential upward movement in price), you might enter a ‘buy’ order. If it’s a bearish pin bar (indicating potential downward movement), you might enter a ‘sell’ order.

Set Stop-Loss and Take-Profit Levels: Your stop-loss should go slightly beyond the end of the pin bar’s tail – this is the point at which the pin bar signal becomes invalidated. Your take-profit level could be at the next significant level of support or resistance, or you could use a risk-reward ratio, such as 2:1 or 3:1, to determine this level.