The process of drawing supply and demand zones in trading is more of an art than a science. But let me break it down into easy-to-follow steps.
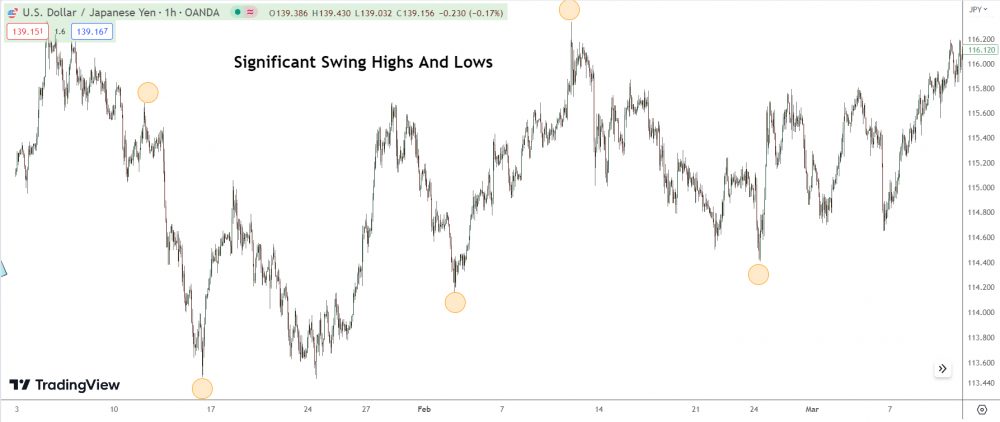
Step 1: Identify Swing Points

Start by identifying the major swing highs and swing lows on your chart. Swing highs typically represent supply zones, while swing lows represent demand zones.
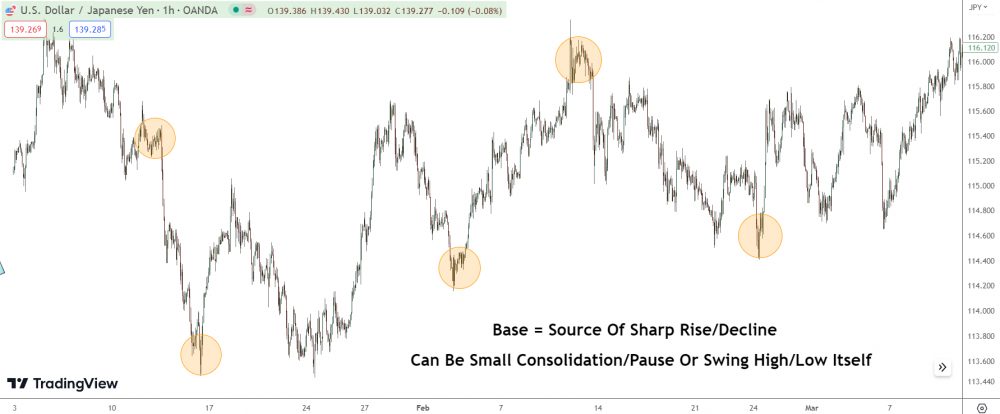
Step 2: Map Out the Base

Once you’ve found a significant swing high or low, look for the “base” – this is the pause or consolidation before the price sharply moved up or down. The base is essential as it represents a significant battle between buyers and sellers before one side took control.
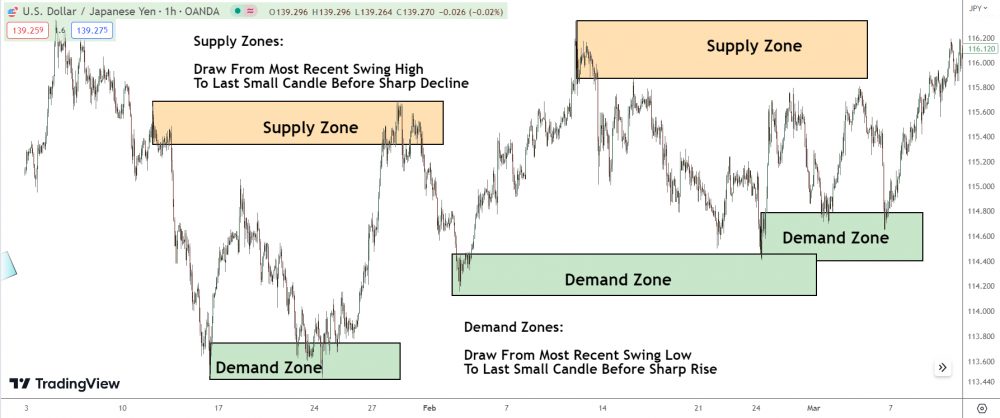
Step 3: Draw the Zone

Draw a box from the high to the low of the base.
Extend this box to the right of your chart to create a “zone.”
Some traders include the entire consolidation area within the zone, while others only include the base. Either way, mark the area where the balance shifted between supply and demand.
Remember, these zones aren’t exact price points.
Instead, they’re areas where we expect a reaction based on the imbalance of buyers and sellers in the past.
Step 4: Future Interactions
Monitor these zones for future price interactions. When the price re-enters a supply or demand zone, you can anticipate a likely reaction.
This is where you can look for potential trade setups.
And there you have it!
Drawing supply and demand zones isn’t about precision or specific numbers—it’s about understanding where the big players have shown their hand.