Hold onto your seats, folks:
When it comes to determining trends, higher highs and lower lows are the most common method. It’s been the go-to strategy for decades, and, well, it’s pretty darn effective.
It gives us an easy way to spot the current trend and sniff out any potential changes on the horizon.
But let’s be honest, it’s not foolproof, right?
Ever noticed price form a higher high or a lower low, hinting at a trend reversal, only to pivot and keep trending in the same direction?
It’s like the market’s playing a cruel prank on us!
Some traders shrug it off, chalking it up to the method’s quirks, but there’s actually a reason behind this tricky behavior.
In this post, we’re going to lift the lid on that mystery.
We’ll delve into why this happens and how to determine whether a new higher high or lower low truly indicates an incoming trend reversal.
Ready to level up your trading game?
Let’s dive in!
Why A Higher High/Lower Low Doesn’t Always Signal A Reversal
Peep the image below…
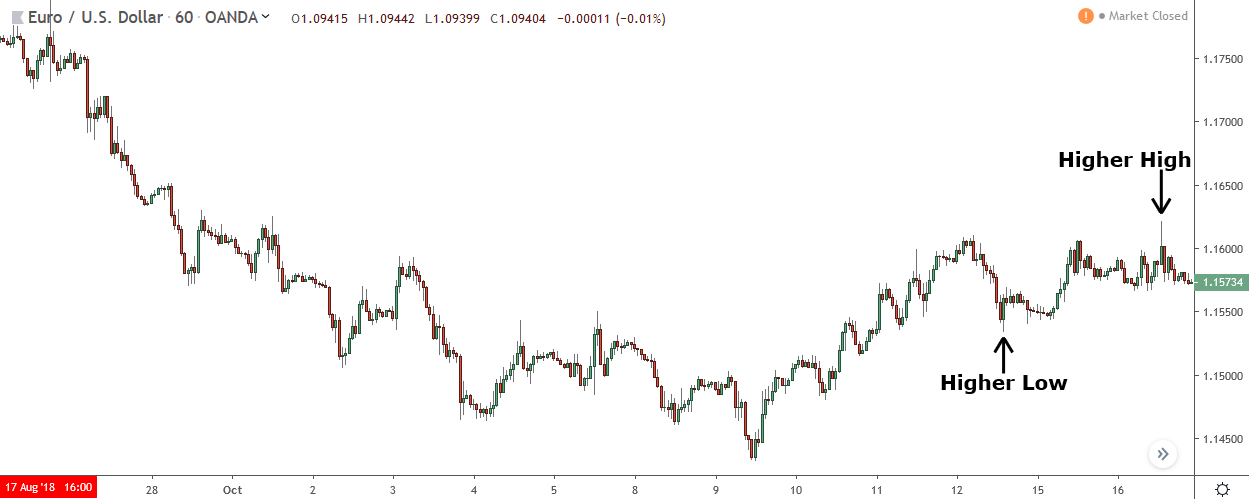
Eur/Usd has just made a higher high after previously sneaking in a higher low.
If you’re a follower of the Dow Theory, you’d be thinking:
“Aha! We’re onto a trend change!”
Why?
Because it’s clear traders are now ready to transact higher than the highest price they were comfortable paying before.
But here’s the twist…
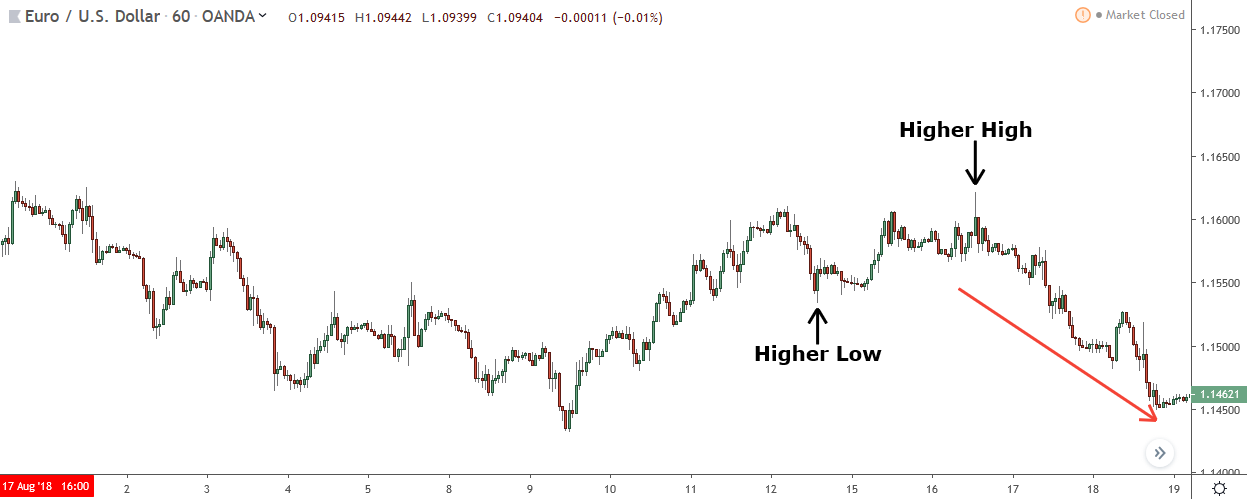
Just when you thought the downtrend was over, price nosedives, smashing right through the higher low.
What does that mean?
It’s a clear red flag the downtrend trend hasn’t changed and is probably going to continue. You might be scratching your head wondering:
“Why didn’t the trend change?”
Well, it’s because the high was nothing more than a wolf in sheep’s clothing…
It wasn’t formed because traders were ready to pay higher prices (like the Dow Theory suggests).
Nope!
It was a sneaky play by the banks placing their sell trades. The banks selling created the high, that’s what made price reverse and start falling.
But how can I be sure?
Well, let’s dive into how the banks cause highs/lows to form:
Swing lows and highs are created by the banks, either placing trades or taking profits – or closing trades, which is basically the same as taking profits.
Here’s the catch though:
When banks place trades or take profits, they never have enough orders to enter all at once.
The banks must manipulate the market to make people buy or sell, so they can push through their remaining trades or take the rest of their profits.
I’ve hammered on this point quite a bit on this site.
But here’s something else to wrap your head around…
When the banks place their remaining trades or take profits, they always do so at a price similar to where they placed their inital orders. This achieves the same effect as if they had entered at a single price – their ideal choice if enough orders were free.
Now, let’s look again at the high in the example…
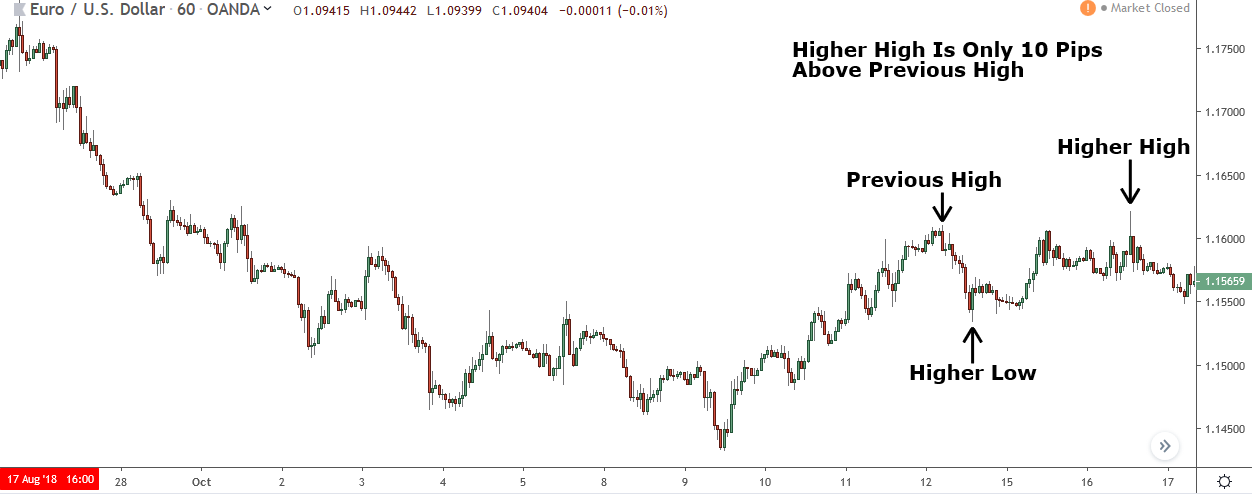
Notice anything?
The higher high forms at a similar price to the previous high.
What does that tell us?
It’s a dead giveaway the high has probably formed from the banks either placing trades or taking profits. Thus, the chances of the high signaling a trend reversal are pretty slim. It doesn’t mean a reversal is out of the question – nothing’s 100% in trading – but it does make it a more of a long shot.
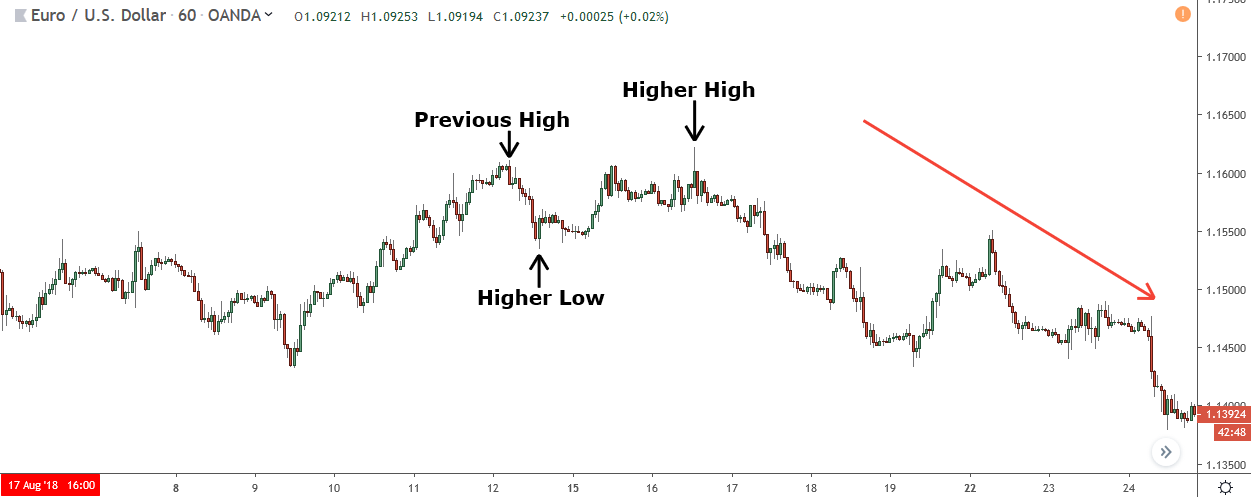
Fast-forward a few hours, and you’ll see price doesn’t wait long to start tumbling after the higher high is made.
That’s why higher highs and lower lows sometimes don’t cause a reversal.
It’s not a random occurrence, like some people might tell you. It’s about how the banks execute trading actions when they don’t have enough buy or sell orders to enter all at one price.
How To Tell If A Higher High Or Lower Low Actually Signals A Reversal
Here’s the deal:
I have a simple strategy to determine if a higher high or lower low genuinely signals a reversal. No complex technical indicators or any special know-how required. All you need is a small understanding of how the banks operate, which I explained in the previous section.
This method hinges on how the must banks take profits and execute trades.
Remember:
Because of how the market operates, banks usually never have enough orders to place all their orders at one price. They must manipulate the market and then place their additional orders when the volume of orders increases.
Here’s the key question: Where do the banks place their orders?
Well, at a similar price to where their initial orders were executed!
Therefore, the way to determine if a higher high or lower low actually signals a reversal is by eyeballing how far the higher high or lower low has breached the previous high or low.
If it’s breached by a small distance, it’s most likely indicating a reversal.
Why?
Because the banks always place their trades or take profits at similar prices.
If it’s breached by a large distance, it’s probably not a reversal.
I know, I know, it sounds a bit ambiguous, so let’s clear the fog with some examples…
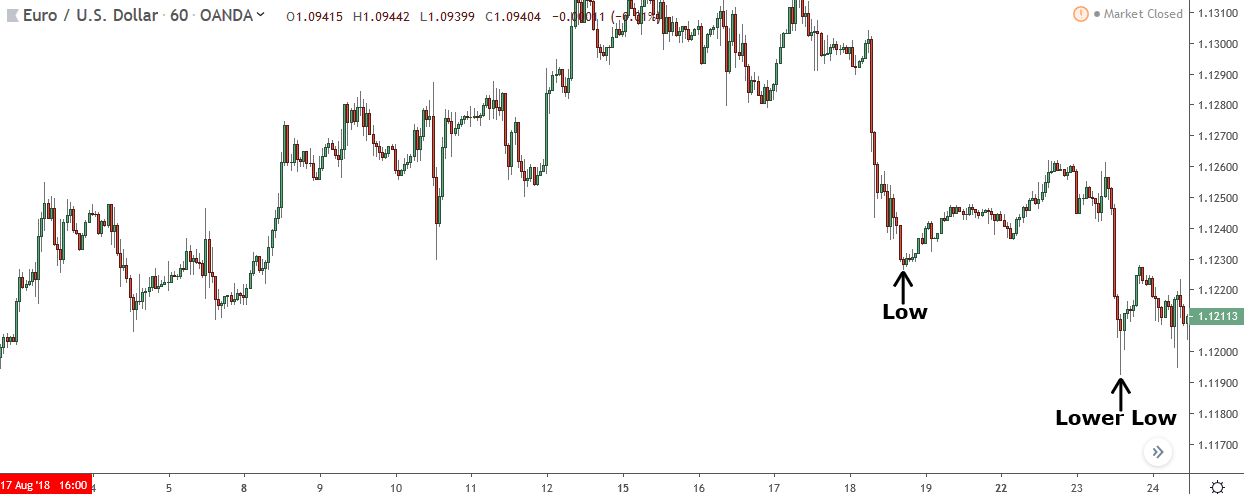
First up, here’s what I mean by a “large distance”.
Notice how this lower low has broken the previous low by quite a margin? It hasn’t just peeked below and then stalled, like we’ve seen in other examples.
No, it’s bulldozed through and forced price far below.
Now, let’s look at what I mean by a “small distance”.
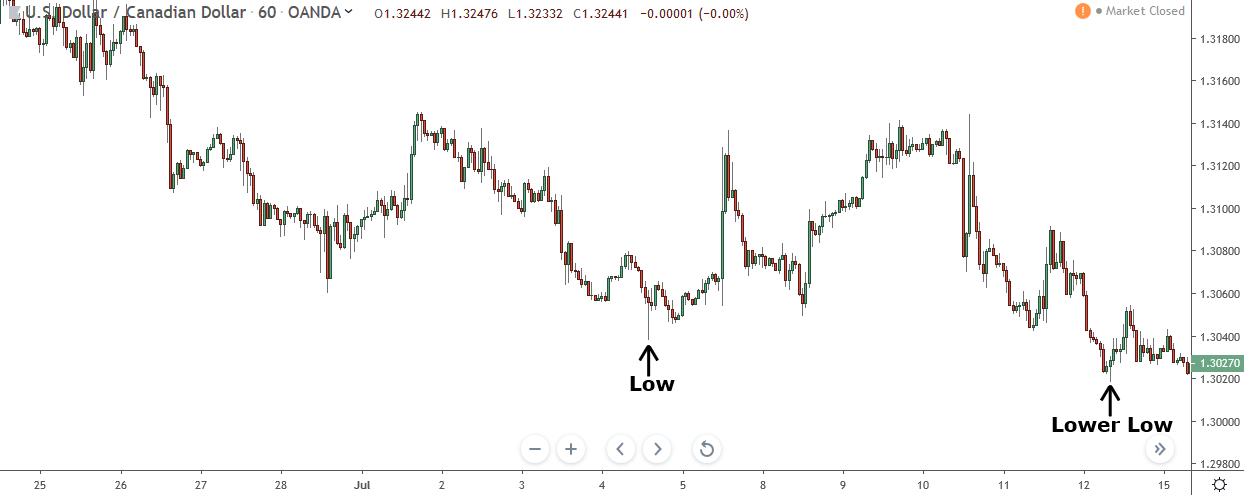
See this?
This lower low has just barely dipped below the previous low, forming at a similar price.
These are the types of higher highs or lower lows that do signal a possible reversal of the current trend rather than a continuation. Highs and lows created at similar prices are the handiwork of banks entering additional orders around the same point.
Example:
Here’s a quick example explaining how to determine if a higher high or lower low is a true sign of a reversal or continuation.
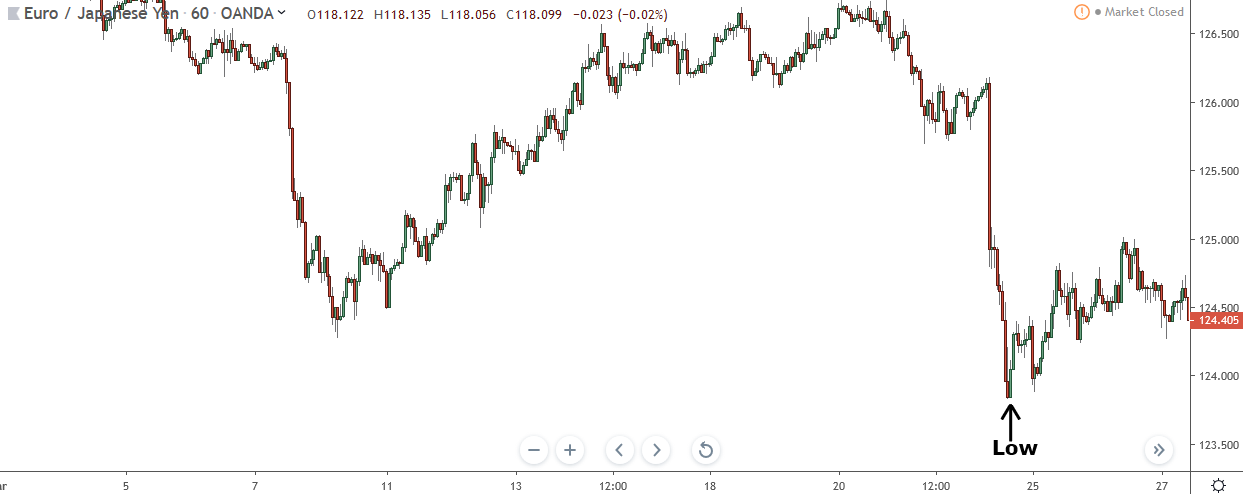
Eur/Jpy just formed a new lower low.
In hindsight, we know this new low formed from the banks taking significant profits.
At that very moment, however, you were in the dark – you didn’t have a clue! But what you did know was the low had formed from the banks either entering buy trades or taking profits off sell trades.
After all, those two actions create every swing low in the market.
So, what happens if the banks haven’t filled their orders?
Well, they’ll coax price back to this low and then enter their remaining orders, possibly creating another low at a similar price. The low won’t form miles away because the banks want to enter their remaining orders at a similar price to their initial batch which create the first low.
Remember: Banks want to mimic entering all their orders at a single price.
So, here’s what happens:
Price starts to tumble, which, in turn, sparks sell orders as it appears to be a continuation of the current downtrend.
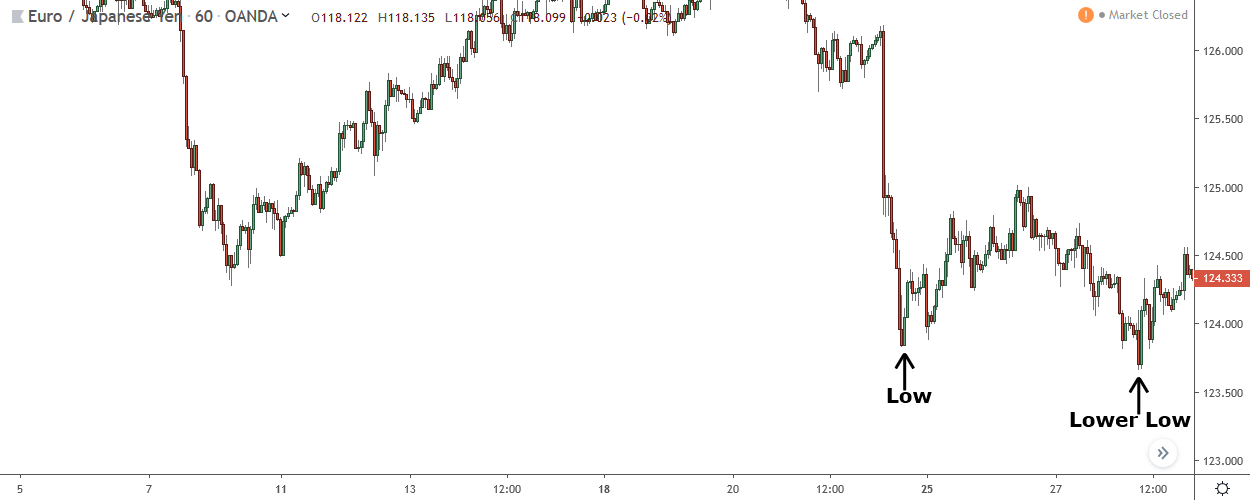
Then, when price hits the low, it briefly spikes through before rising again, carving out a fresh lower low at a similar price to the previous low.
According to the Dow Theory, this trend is now primed to continue.
The lower low, coupled with the earlier low, confirms the trend is alive and kicking.
But we know different:
You know the new low forming at a similar price to the previous low means it likely formed from the banks placing buy postions; either to take significant profits off short trades or enter large buy trades. You can’t be sure which it is, but you know those are the only two options.
And would you look at that?
A few hours later…and bam!
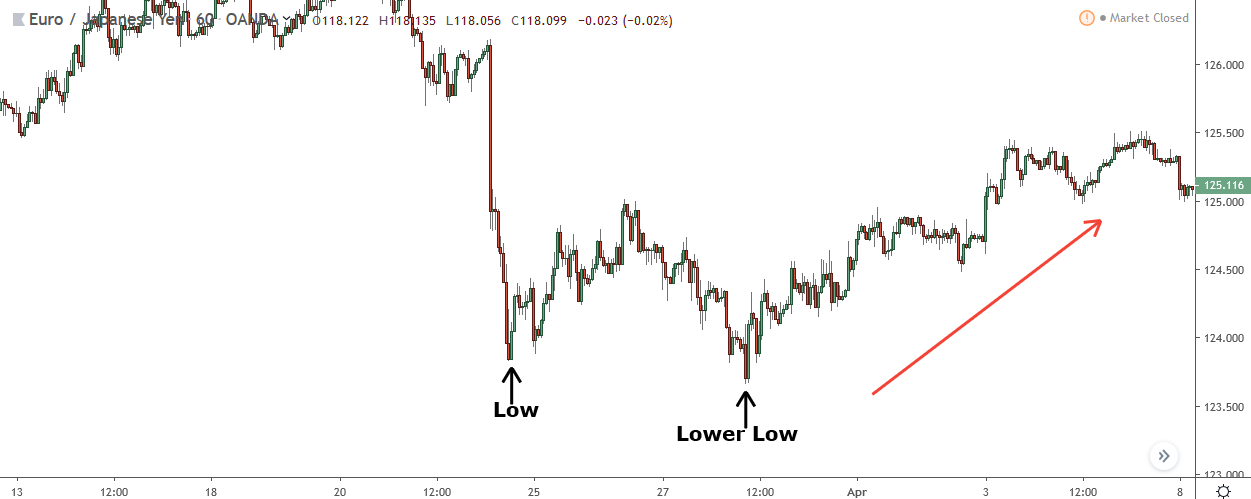
Price moves higher, causing a significant reversal.
Why does this matter?
Because knowing this new low probably formed due to the banks buying – thanks to its closeness in price to the previous low – gives you a heads-up price might soon reverse.
It clues you in the new low probably isn’t signaling a continuation.
It doesn’t mean a continuation is completly off the cards, because in trading, nothing is ever set in stone! But it does decrease the likelyhood significantly.
The Bottom Line
Look, I get it.
This method might seem a little wishy-washy, a tad bit vague.
But once you get a grip on how far price should break the previous high or low, it’ll become second nature in your analysis.
Here’s a pro-tip: Take a trip down memory lane.
Go back and examine some of those higher highs/lower lows that failed to signal a reversal. You’ll find most failed because price only managed to slightly spike above or below them. If you can keep a mental snapshot of what those instances looked like, it should take some of the ambiguity out of this method.
Does that sound like a plan?
Let’s get trading!