Gets old, doesn’t it?
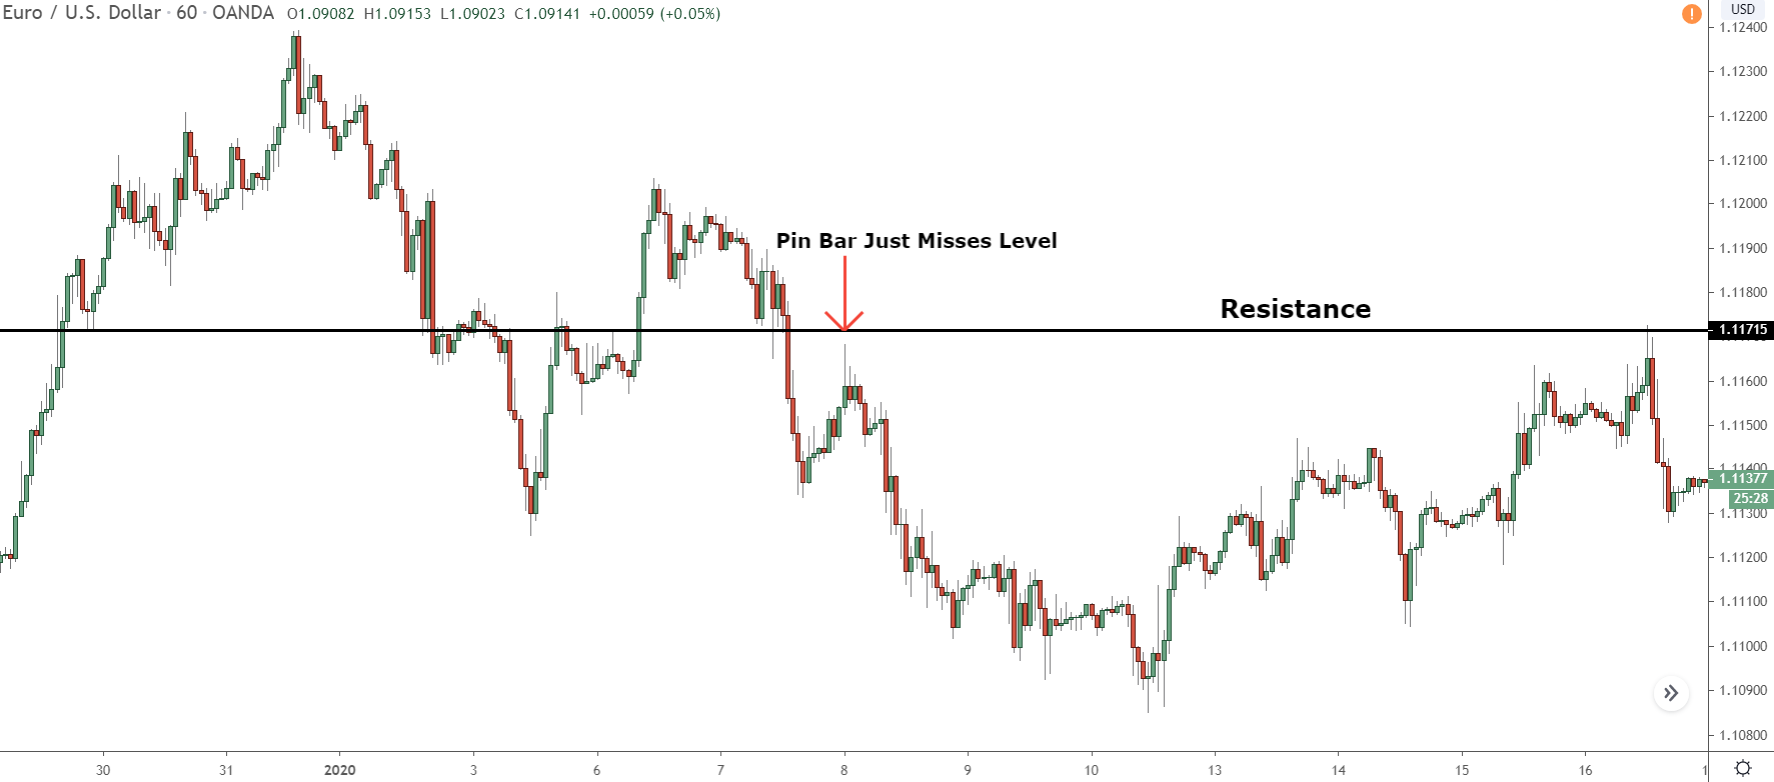
You set a resistance level, eagerly awaiting the price to return for a hopeful entry into a significant reversal. Yet, just as the price nears the level, it reverses and veers away, leaving you with no entry signal for the reversal.
Bummer.
If you’re a support and resistance trader, you’re likely nodding in agreement. But here’s the good news: you can significantly reduce this problem.
How, you ask?
By transforming these levels into support and resistance zones.
Intrigued?
Let’s dive in…
Why Price Often Misses Support And Resistance Levels
Have you ever wondered why price often reverse just before hitting a support or resistance level? Is it mere coincidence?
Or a quirk of fate?
At first glance, it may seem so.
After all, what else could sway price? While other technical aspects sometimes influence reversals, they don’t account for all instances. The frequency with which price bypasses the levels feels less like a calculated outcome and more like a roll of the dice.
But let’s debunk that myth.
The reason price often misses support or resistance levels has nothing to do with luck or incorrect level placements.
It’s due to the linear nature of these levels.
Forex is a complex market populated by diverse players: short-term traders, long-term investors, companies conducting business, and governments hedging. This mix of participants and their varied motivations injects a certain level of unpredictability.
This means nailing down the exact moment and location of price changes is quite challenging.
So, how does this tie into support and resistance levels being lines?
The linear existence of these levels amplifies the impact of randomness on their effectiveness and their propensity to induce reversals. To trigger a reversal, price must intersect a witha slim line, a tough ask amid the swirling randomness.
Hence, price frequently skirts these levels.
Picture this: If you were fishing in the ocean, would you opt for a rod or a wide net?
Likely the net, as its larger size mitigates the randomness of fish movements, increasing your chances of a good catch.
In the context of support and resistance levels, we’re essentially fishing with a rod (line) in a vast ocean (market), hoping for a catch (reversal).
Given the randomness of market movements, our success rate is predictably low.
Now, let’s explore how we can transform these levels from a fishing rod into a large net, thereby improving our odds.
A Better Way Of Trading Support And Resistance
The primary issue with support and resistance levels is their representation as lines, which are too narrow, causing price to frequently miss them.
This isn’t due to inaccurate drawing, but rather the size of the lines themselves.
So, how do we modify these levels to increase their accuracy and capture more profitable trading opportunities?
The answer, as suggested by the title, is to depict them as zones, not lines. This approach provides a broader surface area for price reversal, similar to supply and demand.

Let’s compare scenarios.
When using lines for support and resistance, price often approaches the level, then reverses a few pips before reaching it, without giving any clear entry signal.
Quite frustrating.
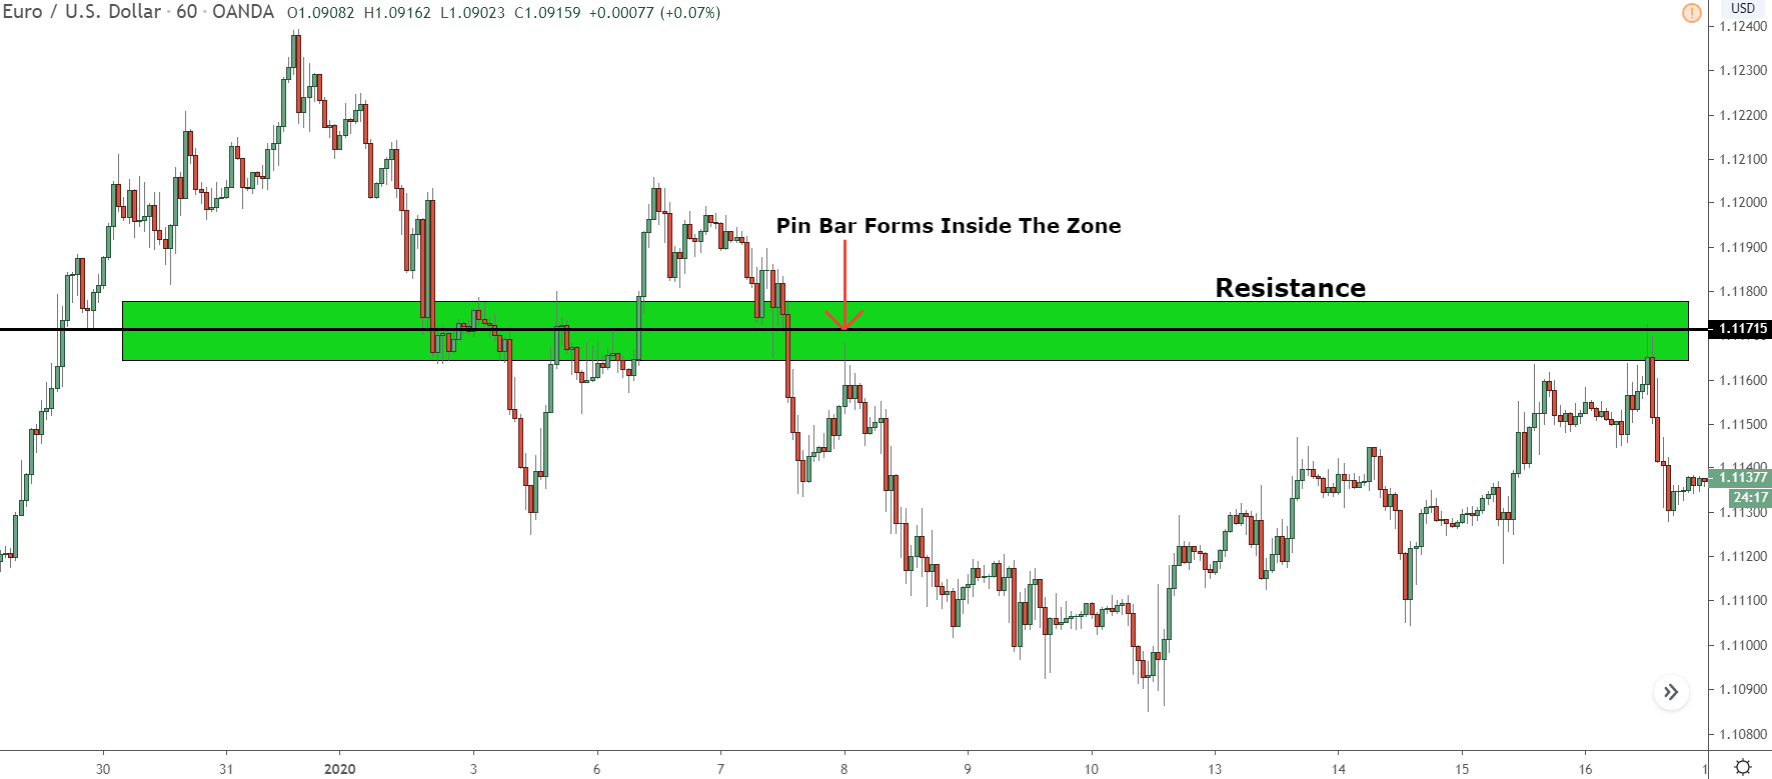
However, if we draw the level as a zone instead of a line, the difference is substantial.

Price reverses within the zone.
It descends, spikes into the zone, and then reverses and ascends.
Even if it doesn’t fully enter the zone, touching and partially entering provides a valid signal to go long.
Therefore, support and resistance zones prove more effective than lines, offering valid long signals when price hits the zone, rather than missing out on potential trades.
Now, let’s discuss how to draw these zones on the chart…
How To Draw And Identify Support And Resistance Zones On A Chart
No need to be a pro to sketch support and resistance zones, but knowing how to draw standard levels is a must, as it guides where to set the zone.
I’ve seen some self-proclaimed gurus teaching how to draw these zones, and honestly, much of it is nonsense. Their approach boils down to: spot a level, slap a zone on top, and voila – that’s your support and resistance zone.
There’s no logical or reasoned approach, just arbitrarily sticking a zone on a level.
Adopting such a method won’t bring you much success.
Let’s go through an example…
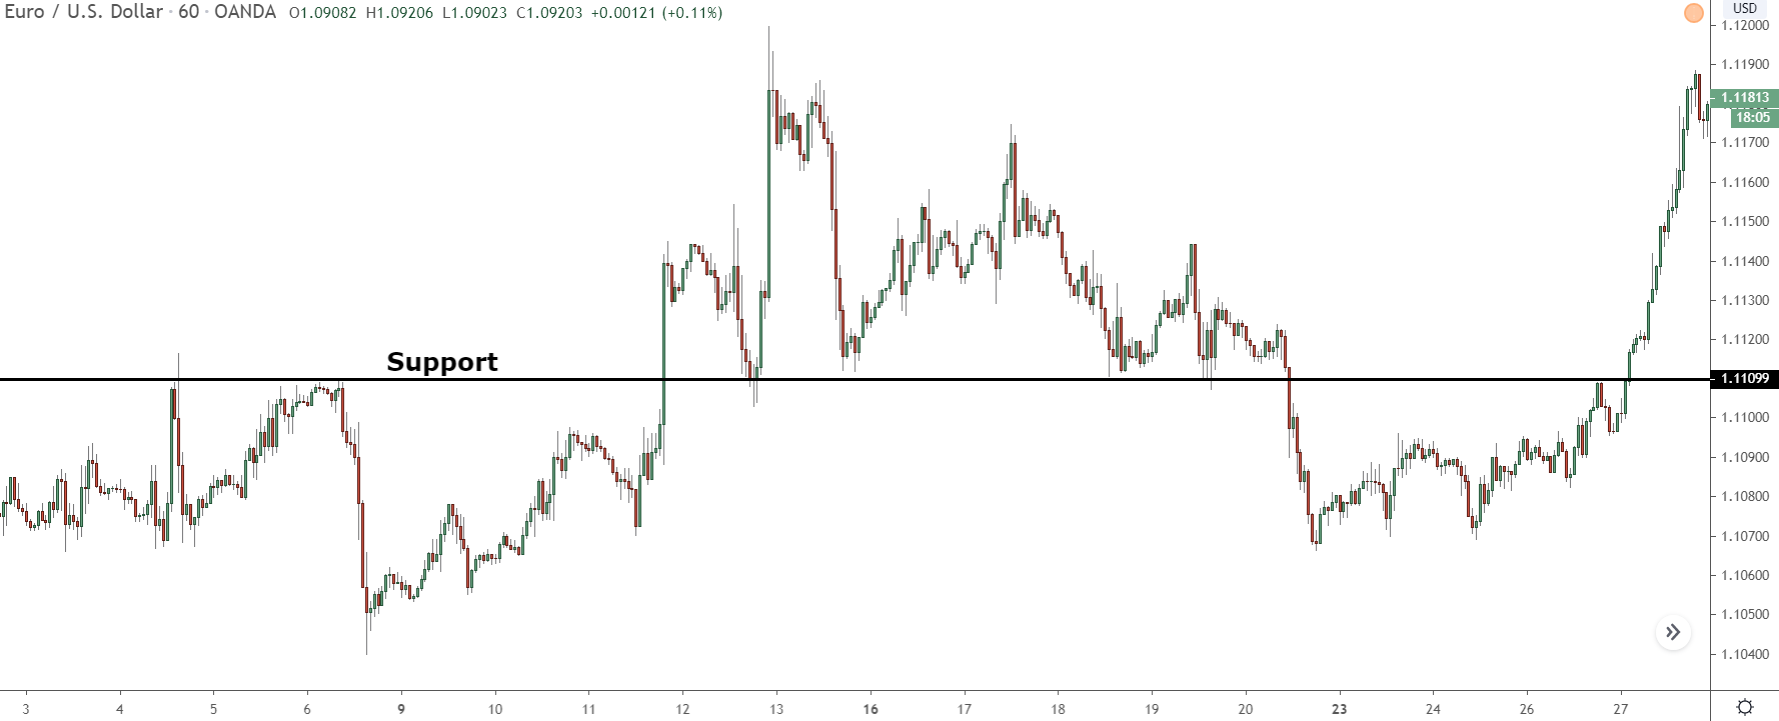
First, identify the support or resistance level you want to convert into a ‘zone’.

Let’s choose this one, as it has several clear touch points.
Now, you can’t just randomly slap a zone over a level – that’s a guru’s move.
The zone needs to be placed such that each edge is an equal distance in pips from the level. If they aren’t, price won’t accurately return to the zone, leading to missed trades.
The number of pips from the line that price needs to be depends on the timeframe in which the level formed.
Lower timeframes see less price movement, hence, a smaller zone.
Conversely, higher timeframes cover a larger distance, necessitating a larger zone.
Here’s a quick guide on how many pips from the center you need to set the zone.
- 1, 5 or 15 min – 50 pips
- 30 min, 1 hour – 100 pips
- 4 hour – 150 pips
- Daily – 250 pips.
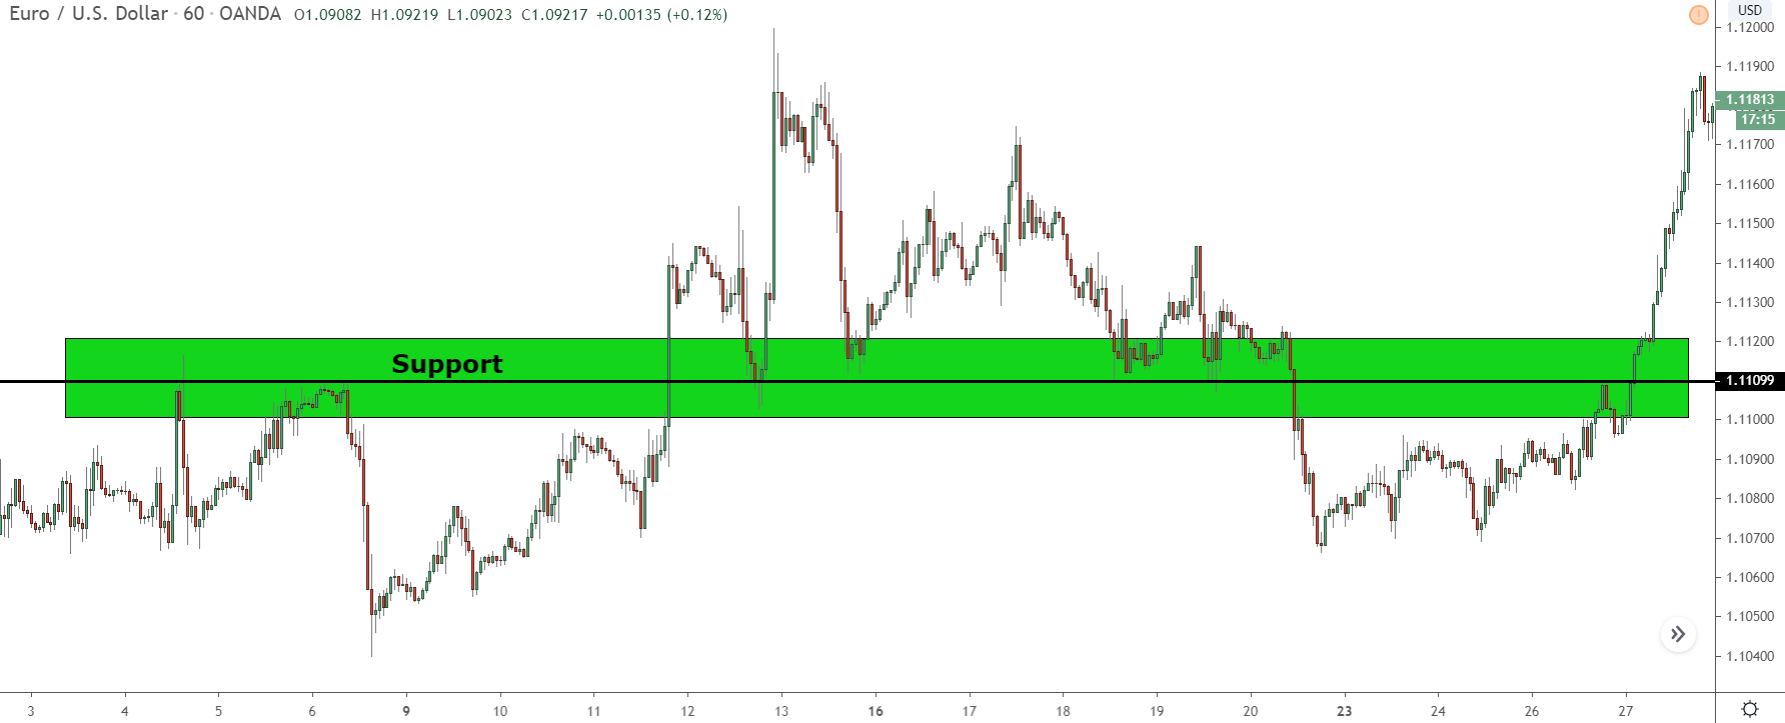
In our example, a zone forms at 1.11099 on the 1-hour timeframe. Mark a zone that ranges from 1.10999 to 1.11199, 100 pips below and above respectively.

Once the zone is marked, observe its edges.
Each is roughly 100 pips away from the level.
Precise marking is not crucial; a deviation of 5 – 10 pips should still work.
Two Ways To Trade Support And Resistance Zones
For trading these levels, you have two options:
- Monitor for pin bars and engulfing candles once the price touches the zone, similar to conventional support and resistance levels.
- Set a limit order at the zone’s edge to enter a trade when the price returns.
Personally, I find waiting for pins and engulfing candles more effective, though limit orders can also yield results.
For the stop loss, position it on the zone’s opposite side relative to your signal – below for a bullish pin, above for a bearish one. Shift the stop to the pattern’s low/high when the price exits the zone to mitigate risk in case of reversal.
Remember: Support And Resistance Zones Are NOT The Same As Supply And Demand Zones
It’s crucial to distinguish between supply and demand zones and support and resistance zones.
While both indicate potential price reversals and are drawn similarly, they are fundamentally different. Supply and demand zones originate from the source of rises and declines.
In contrast, support and resistance zones form at their namesake levels and sometimes align with the sources of rises and declines.
The Bottom Line
In summary, try trading with support and resistance zones. While occasional missed signals are inevitable with any strategy, these zones drastically reduce such occurrences, enhancing profitability.