It’s tempting to believe all engulfing patterns are identical—that the only variation lies in their appearance and location.
But that’s not the case…
There’s a particular type of engulfing pattern that exhibits a significantly higher success rate than its standard counterparts.
Today, I’m going to unveil how to spot this unique pattern.
So, let’s get started…
The Psychology Behind Engulfing Patterns
One common pitfall I’ve observed among price action traders, both rookies and veterans, is their fixation on ‘what’ rather than ‘why’.
Many traders focus predominantly on the visual aspects—the ‘what’.
For instance, when a pin bar forms, their immediate thought is, “Does it have a lengthy wick?” Or when a support level emerges, they wonder, “Is it positioned correctly?”
However, these traders are addressing the wrong things.
Understanding ‘why’ a pattern has formed is vastly more critical than merely acknowledging its formation—the ‘what’.
Engulfing patterns serve as a perfect example in this context.
So, let’s ponder this…
Have you ever considered the mechanics behind the formation of an engulfing pattern?
Of course, we know they form due to the buying and selling activities of traders—I’m not denying the obvious. But have you ever contemplated the specific trading behaviors necessary to spawn such patterns?
Because if you did, you’d stumble upon something truly fascinating…
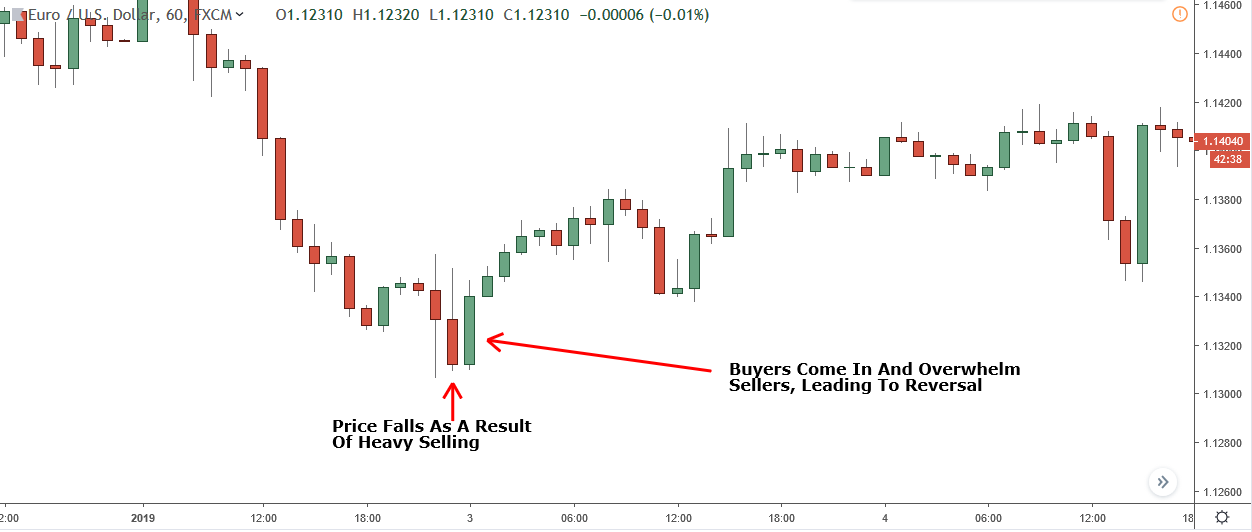
Most resources on price action trading — books, websites, and videos alike — suggest an engulfing pattern arises when buyers (or sellers, in the case of a bearish engulfing) overpower their counterparts.
This explanation, while accurate, overlooks a crucial element: the sequence of events when price starts to eclipse the preceding candle.
Let’s consider a scenario…
Suppose you initiate a sell trade, confident price will plummet. If price unexpectedly starts to rise, what would you do?
Naturally, you’d close the trade.
But how?
By executing a buy order to buy back what you sold.
Now, imagine what happens when price contradicts the predictions of tens of thousands of traders who have either bought or sold. They all inevitably close their trades, introducing a flood of orders into the market that drives price in the opposite direction of their trades.
The sequence I’ve just outlined is the precise process that triggers a price reversal following the formation of a bullish or bearish engulfing pattern.
Here’s how it unfolds…

Price falls, creating the first candle in the pattern.
The decline convinces a significant number of traders price will continue to fall, prompting them to sell to capitalize on the downturn.
Banks and other major players perceive this and decide to utilize the incoming orders to execute their trades.
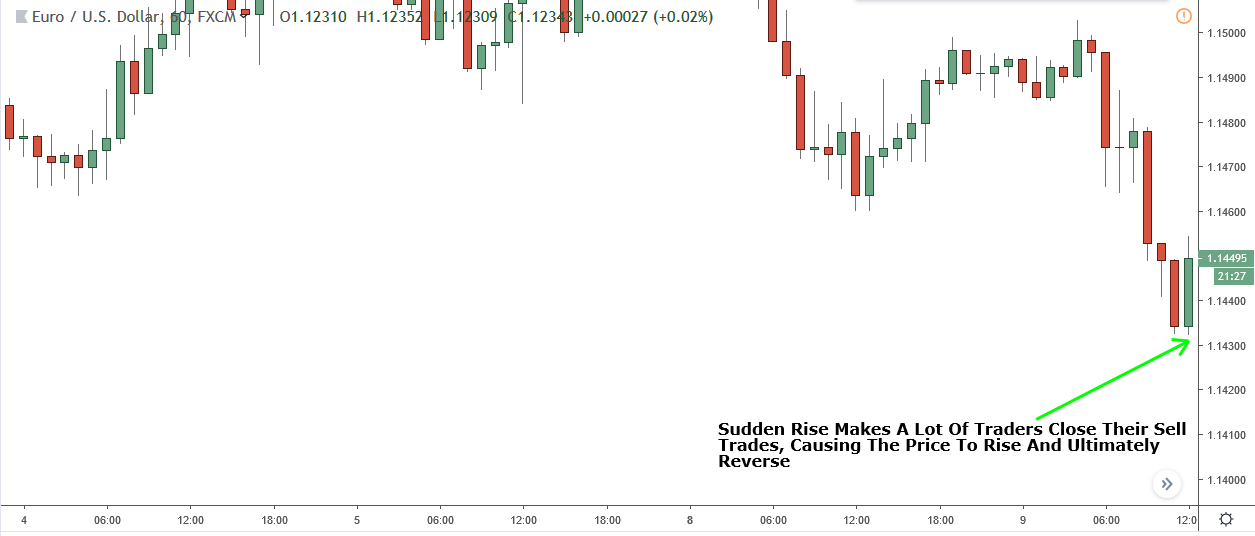
The banks entry into the market causes price to rise, exerting pressure on the sellers and prompting many of them to close their trades.
This, in turn, pushes price even higher, compelling more traders to close their trades, and eventually culminating in the reversal we observe.
That’s the mechanics of how an engulfing pattern creates a reversal.
But why is this important, and how does it relate to identifying high-probability engulfing candles?
Let’s delve into that…
Numerous price action experts assert that all engulfing patterns are identical. They maintain that despite variances in appearances, the likelihood of a pattern precipitating a reversal remains constant, unless the pattern forms at a technical point, which can increase the odds.
This rationale may seem plausible to some, and I once subscribed to it myself.
However, it doesn’t hold water…
Some engulfing patterns indeed have a higher probability of inciting a reversal than others, irrespective of whether they form at a technical point.
How can I be so certain?
It’s all in the formation process.
As I said earlier, an engulfing pattern causes a price reversal because the engulfing candle compels traders who sold (or bought, for bullish engulfing) on the previous candle to close their positions.
This introduces orders into the market, causing the price to rise or fall.
But here’s the intriguing part…
The more traders who close their trades, the more orders which enter the market.
This implies…
An engulfing pattern wherein a substantial number of traders have bought (or sold) on the candle that gets engulfed stands a better chance of causing a reversal than a pattern where only a few have bought or sold on the candle that gets engulfed.
This naturally raises the question:
“How can I discern whether a significant number of traders have bought or sold on the candle that the price engulfs?”
The answer lies in examining the size of the candle…
Big Engulfing Candlesticks Work Best
Here’s an essential fact about price action that you must understand:
The size of a candlestick’s body directly corresponds to the number of people buying or selling upon its closure.
The larger the candlestick, the more traders who are convinced of its potential for continuation in the same direction. This perception prompts them to buy or sell in anticipation of profiting from the continuation.
To evaluate whether an engulfing pattern is likely to initiate a reversal, we must gauge the number of traders who bought or sold on the candlestick being engulfed.
To achieve this, we examine the candlestick’s size.
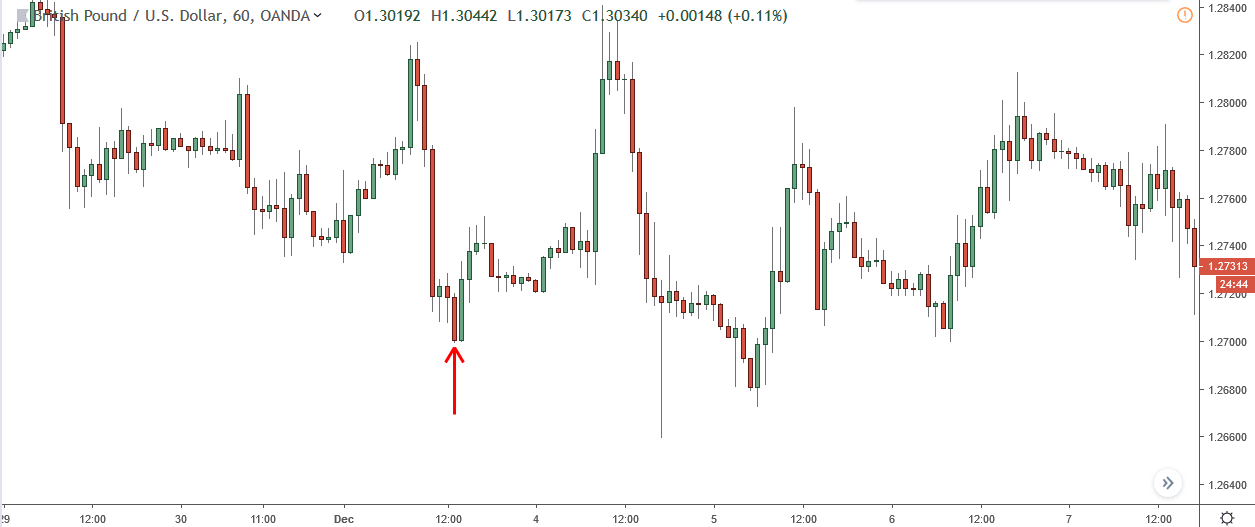
Consider the first candle in the marked engulfing pattern above.
Pretty big, isn’t it?
This magnitude indicates a high number of traders sold during its formation, suggesting a significant number of traders will likely close out their positions through buying when the price engulfs the candle.
Consequently, this increases the probability of price reversal and upward movement.
Here’s another example…
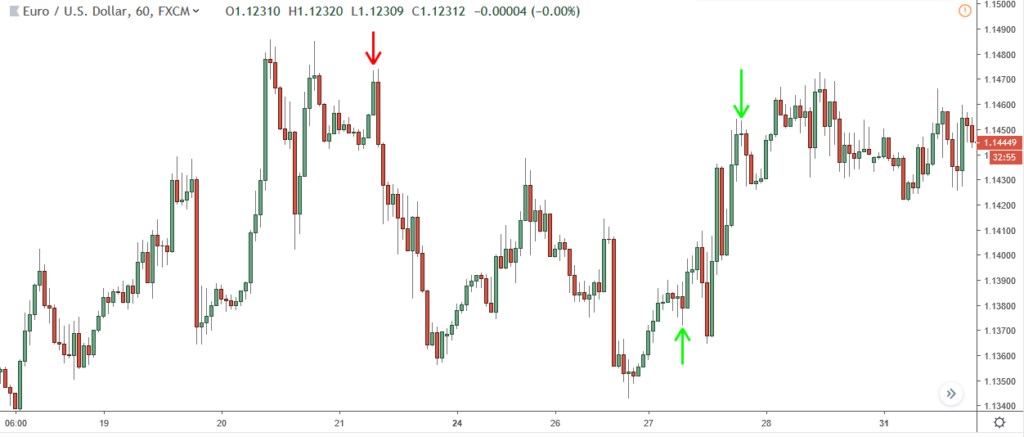
Pay attention to the size of the engulfed candlestick.
Comparing the two other engulfing patterns with the one highlighted in red should give you a sense of the candlestick size necessary for a high-probability pattern.
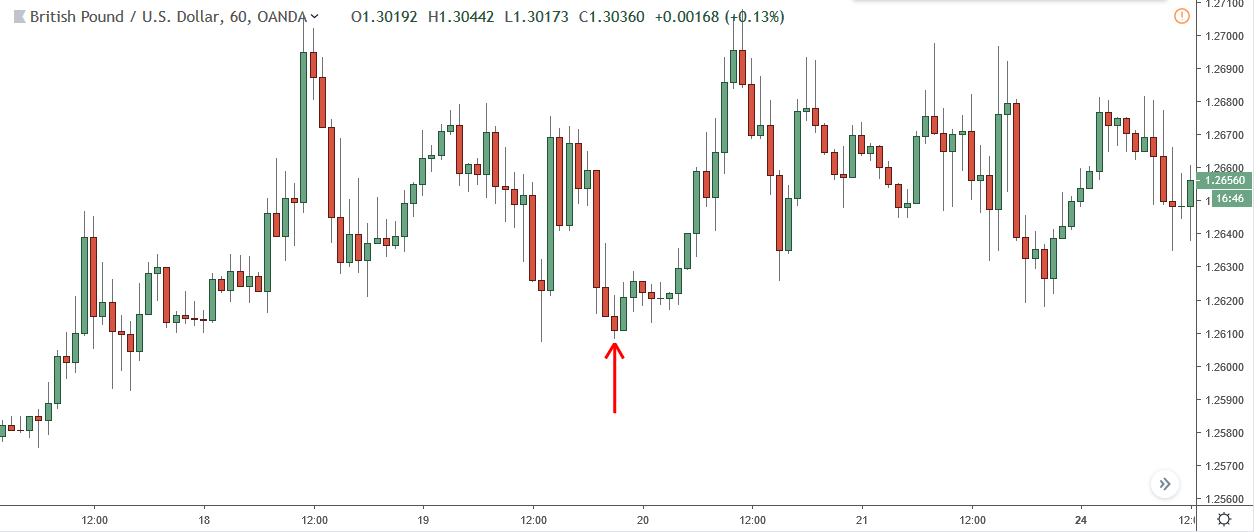
Conversely, you should avoid patterns like the one above.
A small candlestick implies fewer sellers, meaning only a small number of traders will close their positions when the price engulfs it.
This, in turn, reduces the likelihood of a successful pattern.
The engulfed candlestick here is quite small, signifying not many traders were selling during its formation.
This results in a lower probability of sparking a reversal.
Do note such patterns can occasionally work, especially when they align with technical points, but generally have a lower success rate on their own.
The Bottom Line
While it’s challenging to provide an exact size guideline for a high-probability engulfing pattern, hopefully these examples offer some clarity. More information on engulfing patterns will be available soon.
Meanwhile, I’ll include any important links below.